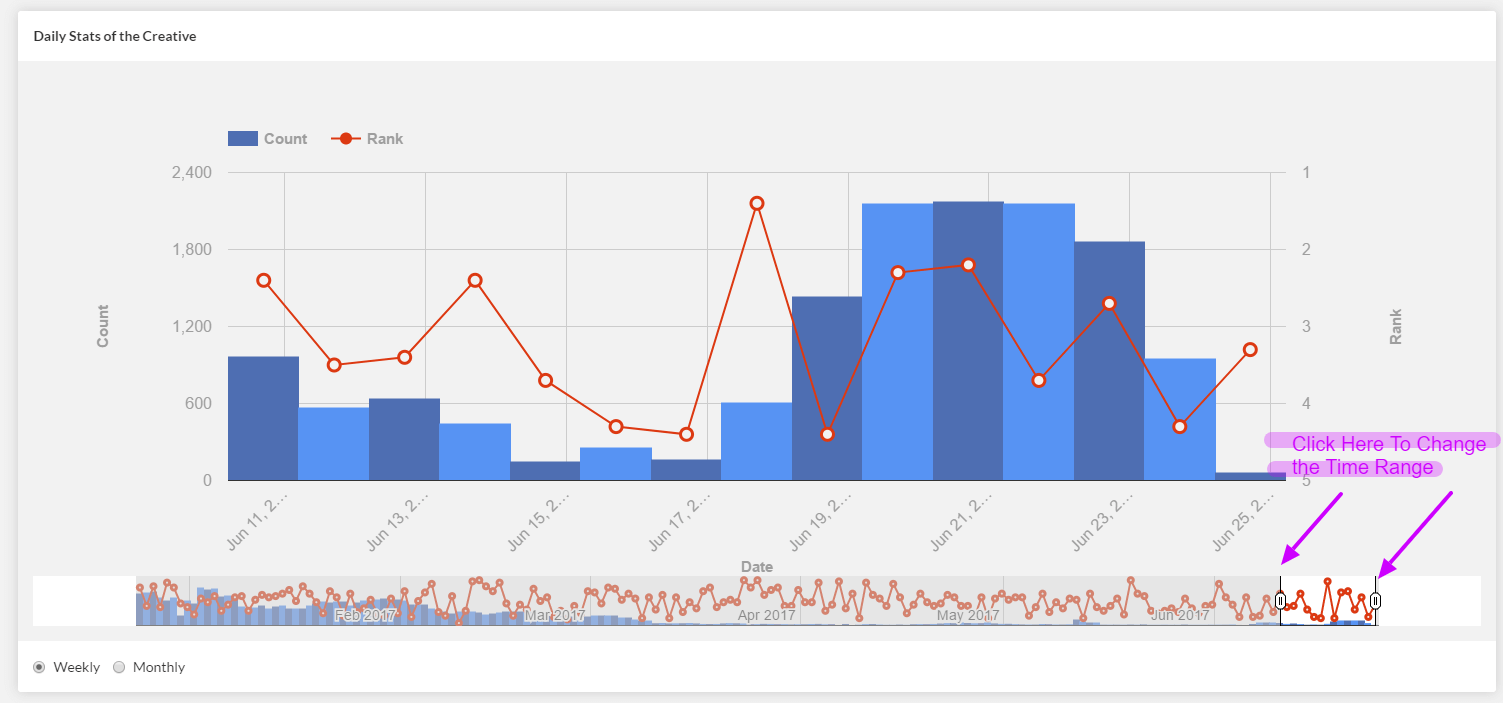
The default view shows the chart data from last two weeks. In order to change this two week time range you can click and drag the controllers on the rangefinder view right below the chart as indicated in the figure below. Maximum range is 1 year.
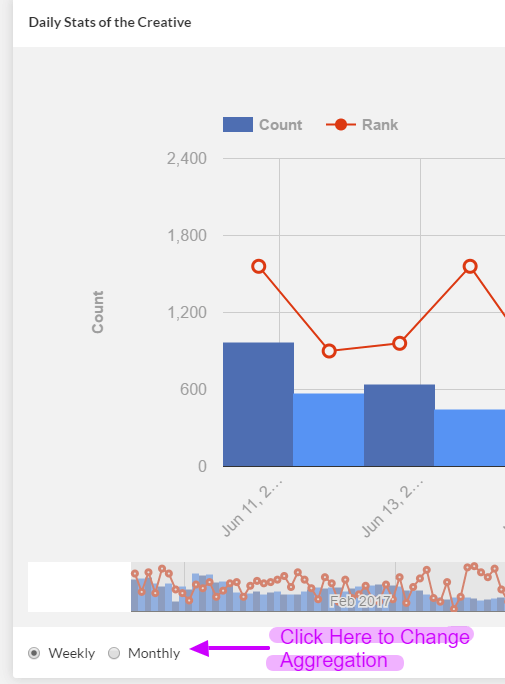
Additionally, you can change the aggregation from weekly to monthly or vice versa by clicking on the radio buttons at the bottom of the chart as shown below: